The Failure History Method for Predictive Maintenance ROI Calculation

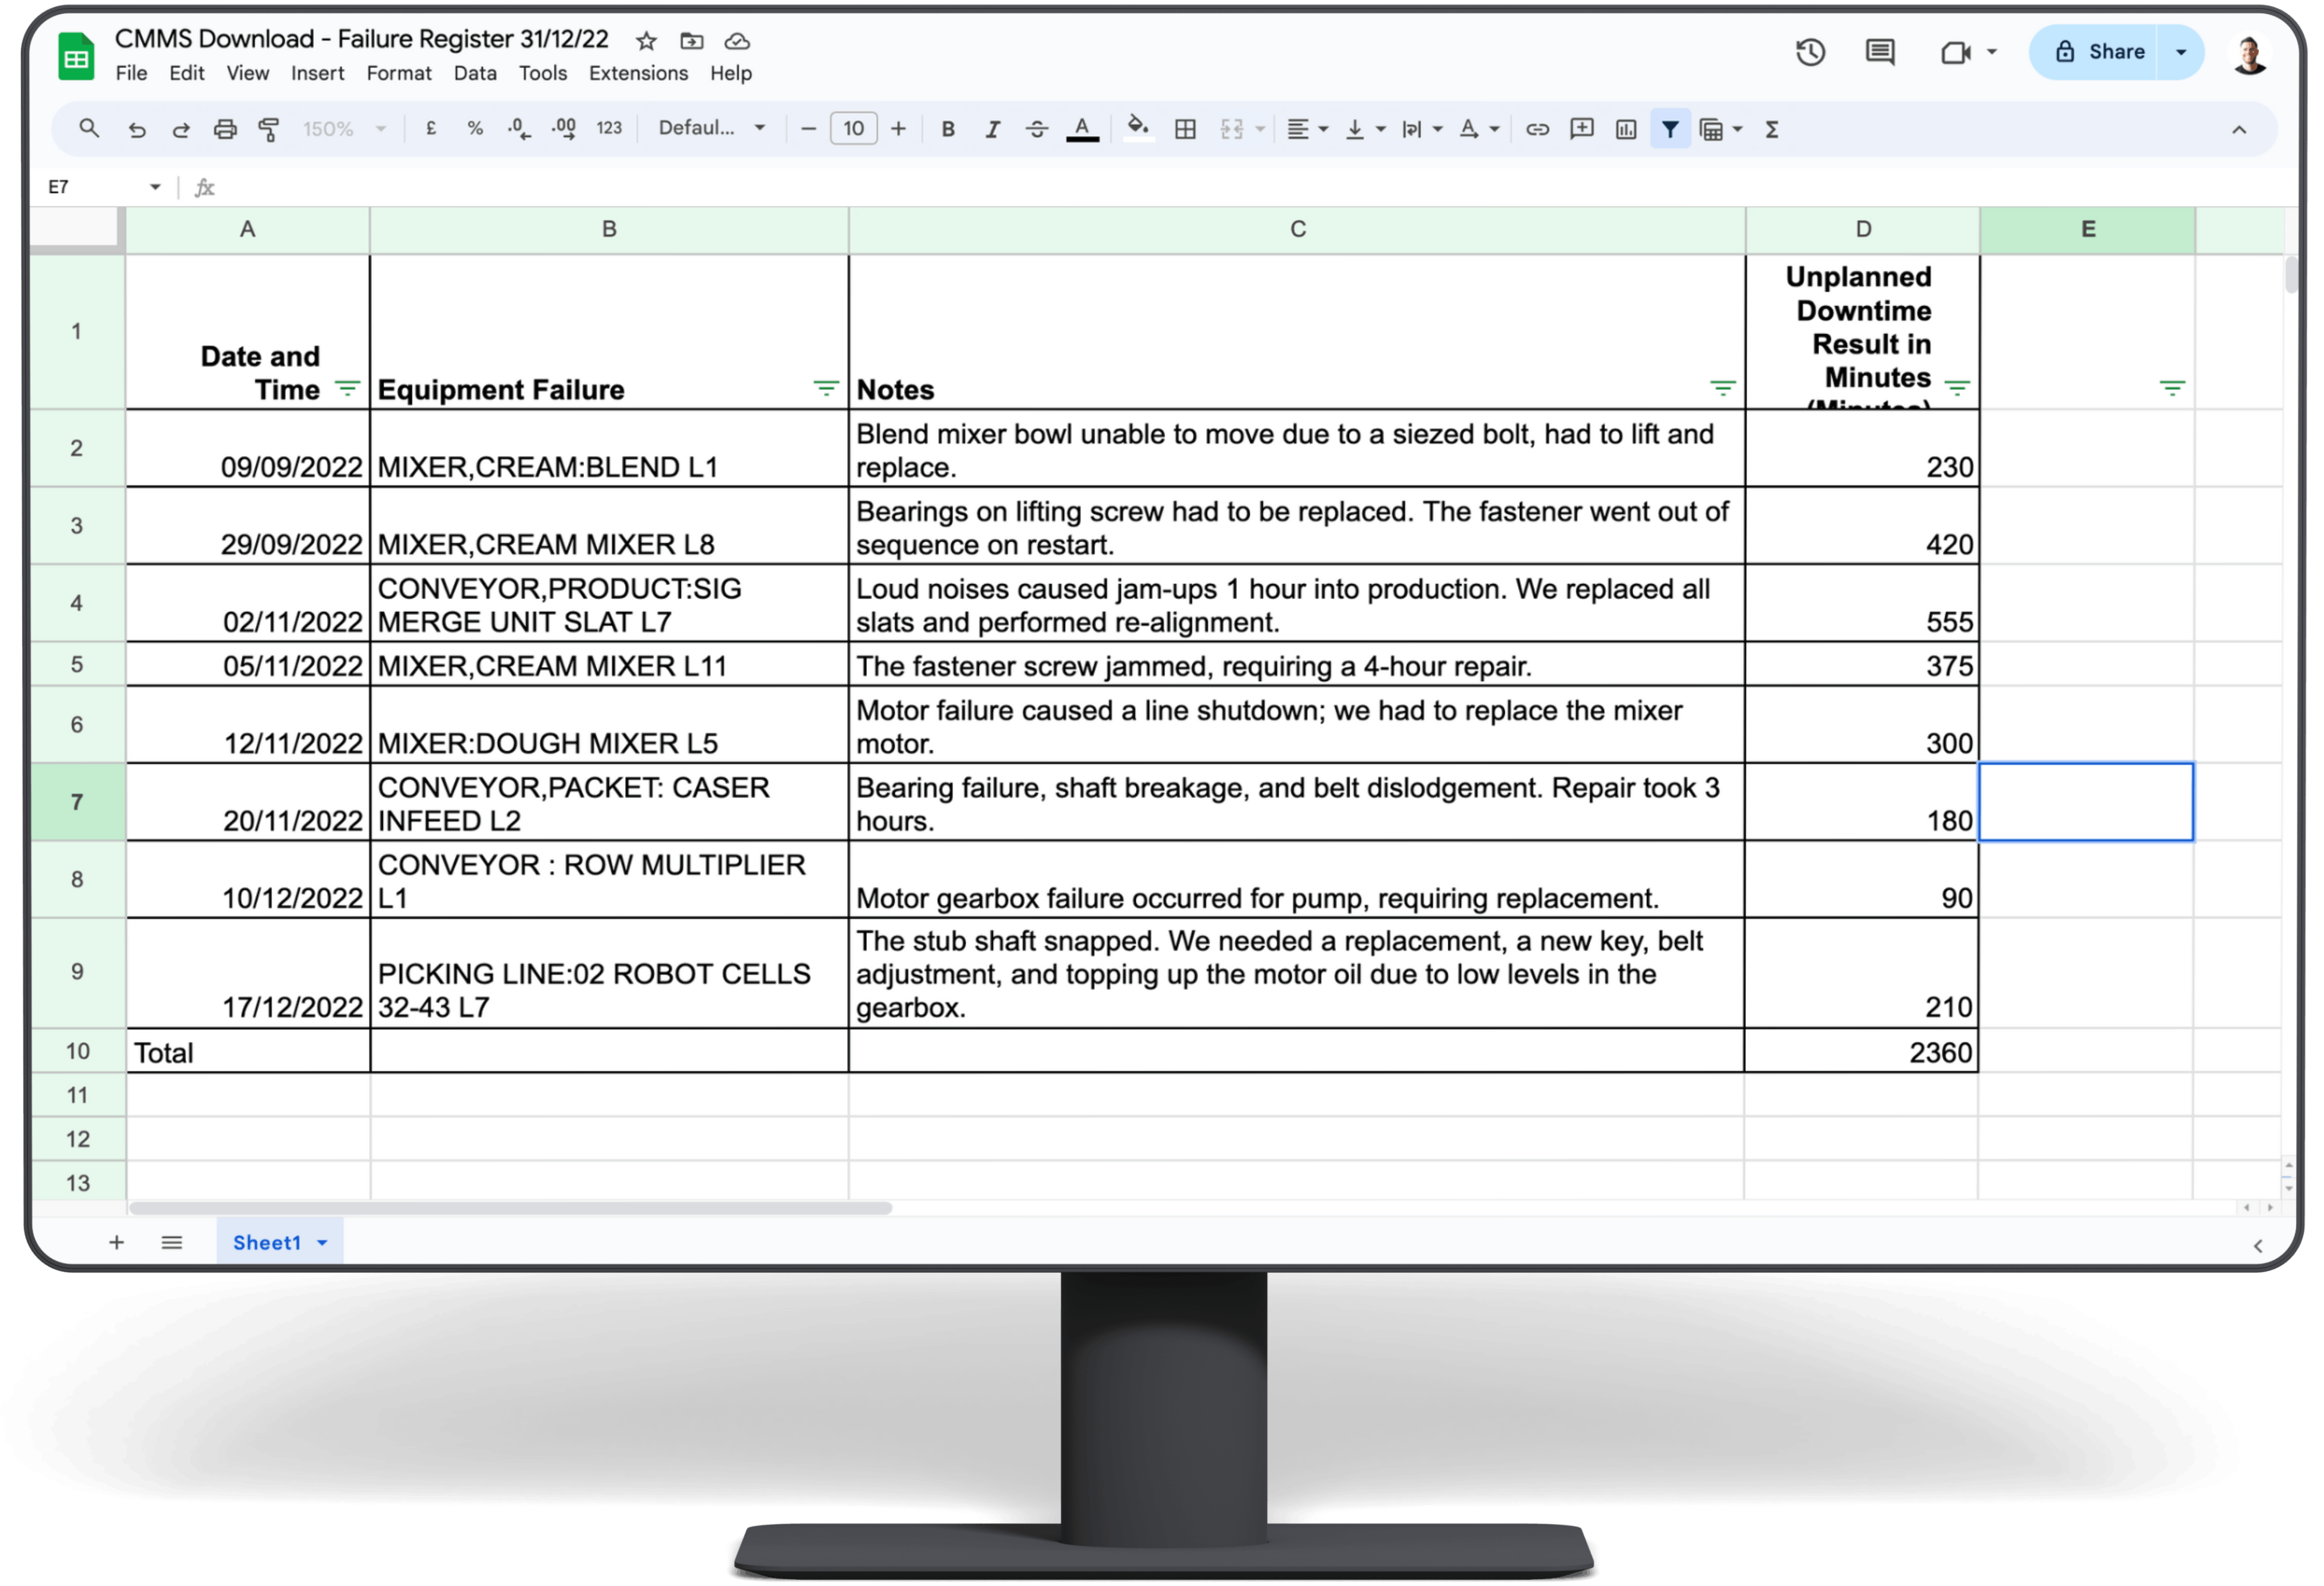
In this post, we guide you through six steps using the failure history method to estimate the ROI of implementing Predictive Maintenance Software.

The Failure History Method for Predictive Maintenance ROI Calculation

Introduction

Building a robust business case for predictive maintenance software is a central focus in our conversations with both current and potential clients.

For us, a strong Return on Investment (ROI) is fundamental. If, throughout our discussions, we can't envision a path to at least a 5X ROI, then it's likely not a conversation worth pursuing.

If you're the project champion tasked with pitching the initiation of a predictive maintenance pilot (or proof of value) internally, the prospect of pinning down a specific ROI might seem daunting initially. We can help with this, whether you decide to work with us or not.

We wrote before about how you can calculate and forecast your Return on Investment (ROI) in our article about 3 Quick Steps to Find Out if PdM makes sense for you. 

What we want to do here is to take a deeper dive into one of the many ways in which some customers like to create an ROI estimate and present it to their leadership as part of seeking approval on a predictive maintenance software. We call this method the failure history method. Let’s jump in. 

The Failure history method

At the core of it, we like this method because of its simplicity. To make it possible however, you will require some historical data, which you will draw from your CMMS. If your site has not yet implemented a CMMS, this method is still possible, but more difficult. 

Step 1: Download your failure log

What you want to do is to open up your CMMS and head to your failure register. This will bring up the equipment failures that caused downtime, alongside their associated downtime they caused in minutes, with the notes from the trades, engineers or operators who logged the fault.

Step 2: Remove failures you are sure you couldn't have caught

This is typically the initial point people raise. We all think of the instances like when someone drove a forklift through the conveyor belt or when a brownout left you inactive for 6 hours.

Unforeseeable events will always occur, even with top-notch technology. Exclude these from your failure log report here, leaving events you think can be mitigated. Your confidence in capturing them doesn't need to be 100%, as we'll account for a margin of error later.

This could look like this:

Use your CMMS data to total up failure history for a specific period of time

In this hypothetical example, we’ve got a total of 2,360 minutes of unplanned downtime. This is 39 Hours. 

Step 3: Add in the Cost of your Downtime

If you’ve recorded the length of downtime these equipment failures have generated, the missing piece of the equation is the cost of your unplanned downtime. We recognise not all reliability leaders have a perfect measure for this. If you don’t, then good enough will work. To make it easier, use a range (ie. our cost of unplanned downtime per line is not likely to be less than $5,000/hour, and unlikely to be more than $20,000 / hour. Therefore we land at $12,500 / hour. 

In this hypothetical example, we have a cost of downtime per hour of $12,500. 

Step 4: Total Up Downtime Events for last 3 months

What you should be able to do now is add up to your total amount of unplanned downtime in the last 3 months. 

In this hypothetical example, with 39 Hours of downtime, multiplying by $12,500 leads to $487,500 from unplanned downtime in the last 3 months. Extrapolated to a full year, that’s $1,950,000.

Step 5: Apply a buffer to what you think can be captured with Predictive Maintenance software

It should come as obvious that using an accurate predictive maintenance software won’t possibly solve all your problems. 

At a high-level, not all failures will be successfully overcome given:

  1. Some failures won’t be picked up from the machine learning models
  2. Some failures will be captured, but the team won’t be able to take action on them promptly 

Therefore, you want to apply a buffer here and use a range. Something along the lines of: “We don’t think we can capture more than 50% of failures, but we’re confident we can capture more than 5% of them”. The midpoint here is 27.5%. 

In this hypothetical example, with an extrapolation of $1.95M in equipment failures for a year, if we apply a 27.5% improvement, we’re estimating we can save $539K from capturing equipment failures ahead of time. 

Step 6: Work backwards from a target ROI

At this point you could go straight to the market and start to evaluate the options that are available to you, but we suggest you don’t do that just yet. Working backwards from a realistic target solution cost will help you determine how to go about your search for a solution. 

There’s a few key points to keep in mind as you go about thinking of your desired ROI. Namely:

  1. Your ROI will increase over time as ML models make predictions on higher amounts of data, therefore leading to more accurate predictions. 
  2. Your ROI will also increase over time as you will likely increase your pool of monitored assets, and therefore will capture more failures to act upon.
  3. Your team will get better at using the software and developing a a more efficient workflow to act upon the alerts, also increasing the ROI over time. 


So essentially what you are trying to aim for is a minimum ROI of 5x to begin with, with a goal to increase this to 10x and much more over the next 2-3 years. 

In this hypothetical example in which we’re estimating we can save $539K from capturing equipment failures ahead of time, applying a desired 5x ROI means the total price of the solution must be no greater than $107K / year. 

Step 7: Turn this into a business case, and keep your vendor accountable 

The last step in your process is to turn this simple exercise into a 2 page business case for leadership’s approval. 

You will be asking for $100K to save $500K, and will be seeking feedback from operational and site leadership and your proposition. 

Leadership will undoubtedly offer very valuable points on challenges that are to be expected in getting there, and should also offer very useful insight into assets for which smart monitoring can offer high potential value. 

Conclusion

This is one of the many ways in which you can go about calculating your ROI. We like this method given it will be reasonably simple and straightforward for many reliability and maintenance leaders. 

There are nuances along the way of course, and getting a business case approved will come with some pushback from many leaders that hold a “if it ain’t broken, don’t fix it mentality”. The good news for you is that armed with this information, you will be able to show that things are in fact broken, and it needs to be fixed. 

If we can help at all in the building of this business case, just reach out, always happen to lend a hand. 

JP Picard

JP Picard

JP is the Co-Founder and CEO of Factory AI. Previously, he held senior sales leadership roles at Salesforce and Zipline, supporting executive teams in their digital transformation journeys. His passion for reliability and maintenance grows as Factory AI partners with clients to tackle unique challenges