The Predictive Maintenance Value Explained using the PF Curve
Jun 7, 2024
Predictive Maintenance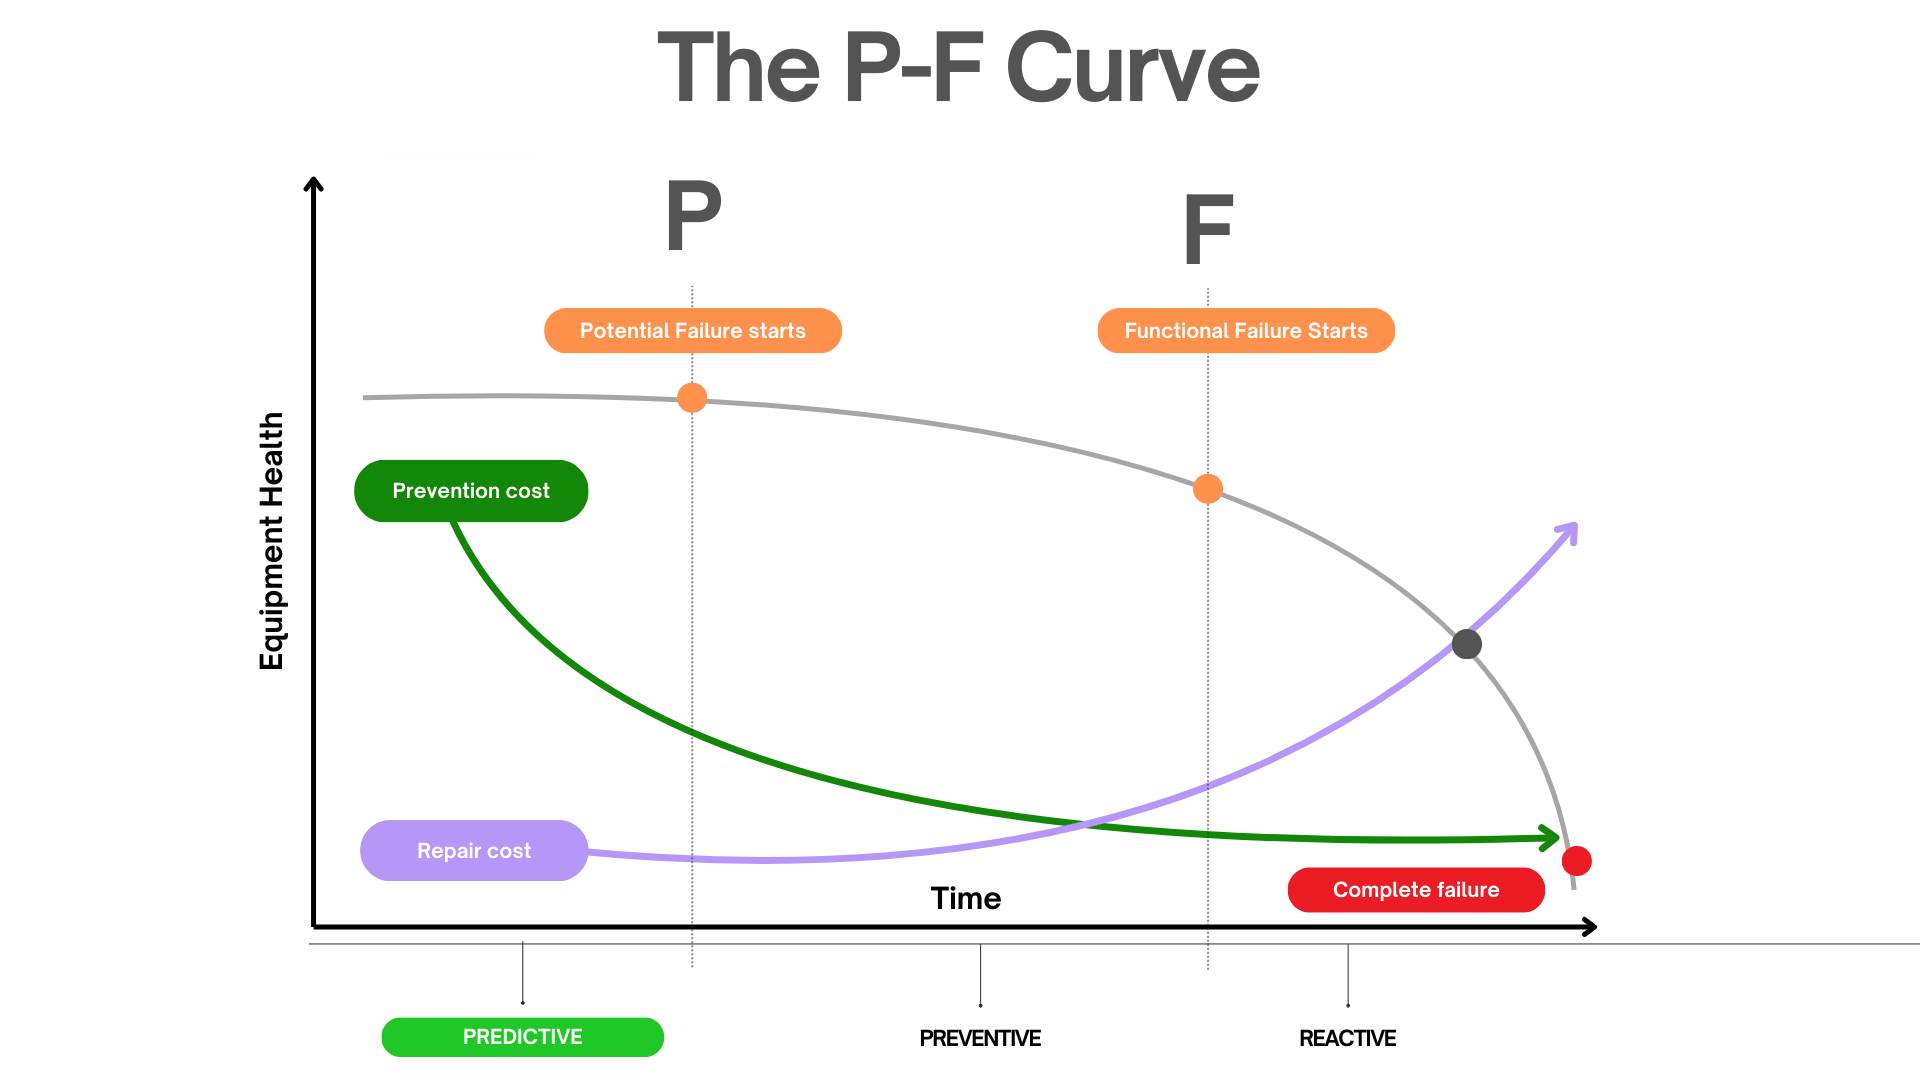
In this post, we visually demonstrate how predictive maintenance optimises maintenance timing and cost through the P-F curve
Introduction
Much of what we aim to achieve with Predictive Maintenance (and through our Predictive Maintenance Software at Factory AI) can be best understood through the concept of the P-F Curve.
The P-F curve serves as a visual representation of an asset's condition before it reaches a state of failure, illustrating its progression toward failure.
As suggested by Ricky Smith of World Class Maintenance, “The intent of the P-F Curve is to illustrate how equipment fails and how early detection of a failure provides time to plan and schedule the replacement or restoration of a failing part without interruption to production.”
Figure 1: The PF Curve and its relationship with different maintenance strategies
On the chart, the x-axis represents the time to failure, starting from an asset's installation, while the y-axis represents an asset or component's resistance to failure.
- P : Potential failure (PF) indicates a detectable state of failure, or the point at which degradation begins.
- F : Functional failure (FF) occurs when the asset or component has reached a failed state or no longer performs satisfactorily.

Figure 2: The PF Curve with different condition monitoring strategies highlighting asset degradation
The most crucial aspect of the P-F curve is the P-F interval, representing the time between potential failure detection in an asset and its eventual failure.
The length of the P-F interval is significantly influenced by how the asset is operated, maintained, and the technology used to detect failure. Many people underestimate this last part; leveraging the right technology to detect and predict failures can profoundly impact the outcome illustrated in your PF Curve.
Pattern Matching
One of the most common questions we receive at Factory AI when discussing with reliability and maintenance teams about the use of our predictive maintenance software is, “How will you know what failure looks like if you’ve only been monitoring this specific asset for a few months?”
This is a relevant question.
The answer is that similar assets will follow similar patterns. And mostly, the industrial world is powered by similar assets.
The P-F curve heavily relies on patterns. For instance, if one motor ramps up to a specific rpm at the beginning of the production cycle, an identical motor used on another asset (perhaps on a different line) should behave similarly. The same principle applies to pumps powering similar products, drives operating similar conveyor belts, and so forth.
By applying predictive maintenance to all assets of the same class, which is accessible to many sites using the Factory AI platform, our machine learning models can perform pattern matching.

Figure 3: The PF Curve illustrating how predictive, data-driven alerts inform about potential failures at different stages.
Ultimately, the goal for most reliability engineers and teams is to use the P-F curve to design out or indicate failure, rather than simply waiting for it to occur.
Predictive Maintenance Gives You Time to Plan, Which in Turn Saves You Money
As depicted in Figure 3, predictive maintenance leverages various condition monitoring methods to detect when various points on the P-F curve are being approached.
As Ricky Smith suggests, this allows you the time to plan and schedule the replacement or restoration of a failing part without interrupting production.
The method and frequency of detection essentially dictate the length of the P-F interval. In this sense, you can indeed alter the shape of the curve. Taking action on a predictive maintenance alert will reposition you back to a healthy state on the curve.
Modalities of the P-F Curve
Technologies and tools used to detect failure can include (from earliest to latest):
- Oil analysis
- Ultrasound
- Vibration
- Thermography
- Motor testing
- Physical inspection
Each of these testing methods provides specific insights into an asset's operation, with timing information offering further clues about the asset's future. Employing these inspection modes and detection methods can provide early warnings of decreased performance.
Each method also has its associated advantages and disadvantages. Oil analysis can be challenging to perform continuously due to expensive sensors, and ultrasound sensors may become less relevant as many vibration sensors now measure ultrasonic signals as well.
Figure 4: A motor instrumented with a wireless vibration and temperature sensor
For these reasons, we believe that for many assets (such as compressors, pumps, motors, turbines, boilers, heat exchangers, inverters, conveyors, mixers), vibration and temperature monitoring are likely sufficient to detect signs of wear and offer early warnings to take appropriate action.
At Factory AI, we like to help our customers begin their journey of using predictive maintenance software with vibration and temperature monitoring because they can often be captured by the same sensor.
Moreover, there is a wide variety of such sensors available, allowing for the use of more sensors and advanced options for larger, critical assets, while keeping it simple for smaller, essential, or general-purpose assets.
As depicted in Figures 1-3, maintenance costs increase as you approach the failed state, with less time available to mitigate or eliminate failure. There's a common belief that detecting potential failure further from the failed state requires more sophisticated (and thus more expensive) detection technology. However, as discussed earlier, affordable wireless vibration and temperature sensors, combined with operational data, can provide accurate predictive alerts.
Conclusion
In the words of Ricky Smith from World Class Maintenance, “When everyone understands the P-F Curve and how it works in a proactive organisation, life is less stressful, costs are down, reliability is up, and life is good.”
Understanding the principle behind the P-F Curve can indeed benefit you and your team. More importantly, having tangible data points on your assets that align with the PF Curve can significantly improve your work planning and reduce equipment failures in your plant.
If you would like to learn more about how our clients use our software, schedule some time with us, and we'll gladly provide a more in-depth demonstration of how our predictive maintenance software operates.

JP Picard
JP is the Co-founder and CEO of Factory AI.